![]() The world these days is governed by statistics.
The world these days is governed by statistics.
Numbers don’t lie and statistics cannot be argued with, so although they cannot quite tell us what will happen in the future, they can give us an excellent picture of what has already happened, and that can inform our decision making going forward.
This information is powerful in any industry, but in the sports betting world it is especially useful, for both bookies and bettors alike.
The market was wide open for a company who could conduct this level of detailed research and analysis, and in 1996 that company was born; Opta.
They started out solely analysing Premier League matches for Sky Sports, but in the decades since have grown to become something much much bigger and all encompassing.
They are not only used by betting companies and the media, but they also often have the final say on controversial situations, like whether a deflected goal should be credited to an opposition player or go down as an own goal.
For certain betting markets, Opta’s decision could be what wins or loses you your bet.
What do Opta Do?
They started out as a more rudimentary statistics provider, collecting and analysing stats from football matches after the fact that could be used by anyone that had a need for such information.
These days, they have not only increased the depth of their statistical information dramatically, but they can provide them live and have even invented new metrics for looking at games across many different sports that have blown the door off the sports statistics industry.
This includes:
- Football
- American Football
- Basketball
- Ice Hockey
- Cricket
- Baseball
- Rugby
…and many more besides.
They not only record every move that every player makes, they also use these individual pieces of information to create a bigger picture, either across a single game or across an entire season. You can think of them as creating different ways to tell the true story of a sports fixture.
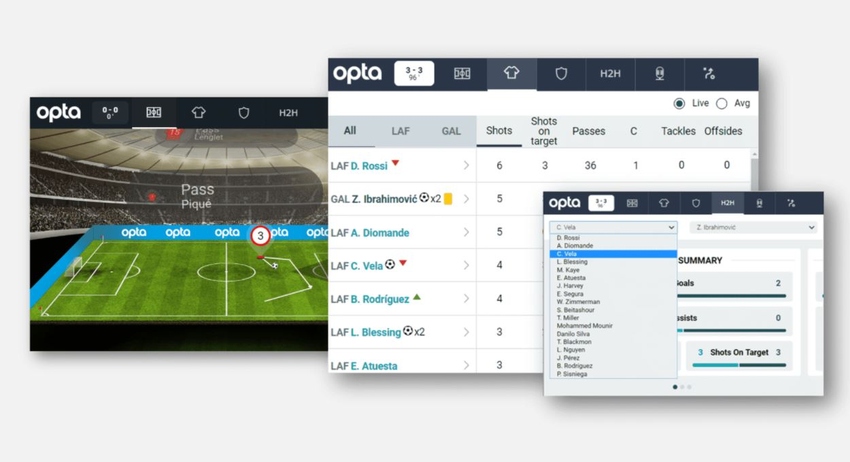
They don’t just collect the data though, they also turn that data into various different sorts of visual representation, to make it easy to understand for the layman.
Football pitches split into coloured zones showing areas of action, or using a snowflake pattern to show a defender’s zone of influence during a game, graphics of attempts on goal creating a very obvious visualisation of which team was more dangerous – Opta turn their data into all of these and more to make it easier for people to tell and understand the story of a sporting moment, a half, a full game, a season, anything really.
In some ways, you could say that Opta provide the ultimate truth using data and statistics.
How are Opta Stats Collected?

You might expect a clever piece of software to be hard at work tracking everything that goes on in games given just how much data is collected by Opta (around 2,000 events per match).
Believe it or not though, the data is input manually by a small army of ‘loggers’, as they are known.
The work is very difficult and requires incredible dexterity and hand eye coordination, as well as the ability to work at speed and concentrate on multiple things at once.
Surprisingly then, it is mostly young men that do the job.
Typically, each game will have one logger watching each team, using a mouse to log passes, for example, by clicking where the ball was passed from, where it was collected, and who the two players involved were.
They never take their eyes from the screen, which shows an interactive pitch where they can draw pass lines etc. with the game itself superimposed over the top, using their right hand to operate the mouse and their left to input the name of the players.
There is a second screen for rewinding and checking anything that was harder to make a call on, and each pair of loggers works with a checker who can ensure the stats being logged are correct and help out with close calls too.
In a Tottenham vs Chelsea showdown it might look like this:
| Analyst Curly | Analyst Larry | Analyst Moe |
|---|---|---|
| Records Tottenham | Records Chelsea | Double Checks Both |
All of the information is sent from the loggers to the media team who turn between 1,600 and 2,000 events per game (passes, corners, fouls, etc.) into useful facts and send them to broadcasters for use by their presenters seconds later – “This is Aguero’s 4th goal from outside the box this season and he has a better shots to goals ratio than any other player in the league”, for example.
The information is also made immediately available to Opta’s other clients which means that live feeds for things like match trackers on bookies websites can be updated.
The selection and training process to become a logger is tough, and many of those working for Opta are video game enthusiasts, as they already have the nimble finger skills the work requires.
A five hour test of each prospective loggers’ hand eye coordination gives the company a good idea of who would be able to cope with the work and who would not, and successful applicants are then trained for around a month before they are ready to work on live games.
Loggers tend to work on games by the same team or teams if possible, as they can get to know the players by sight and make the process more accurate and efficient, but sometimes working on unfamiliar teams is unavoidable.
Amazingly though, the loggers have a 99% accuracy rate, and for that extra 1%, full time analysts are hired to go over every single event in every single match, correcting any mistakes that slipped through retrospectively.
A History of Opta and Stats Perform
![]() Formed in the mid-90s, Opta have been around for decades now, and as technology has improved so much in that time so has what they have been able to offer.
Formed in the mid-90s, Opta have been around for decades now, and as technology has improved so much in that time so has what they have been able to offer.
They started off as a stats provider specifically hired for Sky Sports and their coverage of the Premier League, but it was so successful that other leagues soon followed, and before long Opta were covering matches from leagues all around the world.
Although initially focussed on football, they didn’t take long to expand into other sports too, and only 3 years after their formation the company had been acquired by Sports Internet Group… for just £3.9 million. SIG were in turn bought by BskyB who offloaded Opta to Sportingstatz Ltd, and have probably been kicking themselves ever since.
In fairness, they couldn’t have known that Opta was about to launch the real time data collection that they are now so well known for, which allowed them to offer new and exciting services to those needing live information. Their success in this area led them to expand into sports other than football too, so by 2006 the company was becoming an early version of what it is today, going on to open offices in New York and partnering with the Major League in 2011.
Not long after, a sports media company called the Perform Group bought Opta, holding onto it for a few years before offloading their entire sports data side of the business to STATS LLC, which is where the name Stats Perform comes from.
Opta is now part of Stats Perform, and while what they do is still referred to as Opta data, the company itself is no longer its own entity, and is very much woven into the fabric of Stats Perform.
Opta now provides data on more than 30 different sports across 70 different countries, so if there is a game, race, or competition somewhere that you have heard of, chances are that Opta can provide data for it.
They claim to cover more than 400,000 matches each year, and their stats are used by a wide range of over 1,500 customers including broadcasters, leagues themselves, and bookmakers, proving how valuable this sort of monitoring and recording really is.
What Kind of Statistics do Opta Record?

Everything.
In a football match they will take note of every pass, shot, corner, free kick, foul, card, goal, run, throw in, everything. They will also record where these events occurred, what led to them, what they led on to, who was involved, how long they lasted, etc.
They pull together a full statistical picture of a game complete with info graphics and other useful stuff, with the depth and detail depending on the end user.
This is all information anyone could draw up if they had the time and inclination, but Opta go way further than this and have even come up with their own metrics that didn’t even exist before they invented them.
A few examples of these are below.
Expected Goals (xG)
 One of Opta’s biggest innovations comes in the way of xG, a statistic that did not previously exist but that is becoming more and more prevalent in the media as well as in conversations on the terraces.
Clubs have been using this data for a while now, as it is a good way of showing how well a player is doing in terms of goal scoring compared to the opportunities they have had.
By analysing over 300,000 different shots, the team at Opta have come up with a way to give each scoring opportunity an expected goals (xG) ratio, out of 100. You can think of it as a percentage but it is actually displayed as a decimal; so 37% would be displayed as 0.37xG.
It’s basically a measure of chance quality, so it takes into account a number of factors to determine how good an opportunity exists, and therefore how often on average a player should be converting that opportunity into a goal.
This includes the position on the pitch, the period of play, whether the shot was a header or not, the angle and distance from goal, the sort of assist that led to the shot, whether it was a big chance or not, etc.
So a wide angle shot from outside the box might only have an xG of 0.18, whereas a player knocking in a deflection on the line would be up around 0.95xG because it’s hard to mess things up from there.
A player that scores more than their cumulative xG suggests is converting more difficult chances and is therefore playing better than someone scoring below their xG, as that person is missing opportunities that should be going in based on the stats.
You can also use this stat to measure the performance of a whole team.
Expected Assists (xA)
 A similar stat looking at assists also exists – xA. This one gives every single pass a score whether it turns into an opportunity or not, to give a true reflection of a player’s ability to create chances.
By analysing millions of passes the Opta team have been able to rate each pass on the likelihood of it leading to a goalscoring opportunity.
This is a more accurate way to rate a player’s performance statistically, because a midfield player who consistently serves up great balls which a poor forward never manages to do anything with will not be credited with assists, despite doing their job brilliantly.
On the other hand, an easy side pass or a poorly judged cross that a brilliant forward manages to magically create a chance from will be rewarded with an assist, despite the player who passed the ball not really deserving it.
This helps isolate issues on the field, and gives players who are under performing nowhere to hide.
Both of these metric were invented by Opta, and are already changing the way people in the industry are looking at the game and the performance of the players in it.
Sequences
 Another way of looking at a game, again invented completely by Opta, is through sequences.
A ‘sequence’ is defined as a passage of play by one team that is ended by a defensive action from the other team, a stoppage in play, or by a shot. Each sequence must begin with a ‘controlled action’ by one player on that team, i.e not picking up a random deflection, but a pass with intention.
This can be very useful in highlighting a specific team’s style of play; for example their sequences might include more passes than most other teams, or they may have more possession during each sequence. You can also look at the direct speed of the sequence which might indicate how patient the team is, or how far from their goal line a team’s sequences tend to start, which can show how much they press.
It can also be used to highlight individual players who initiate sequences and who might otherwise not get the credit they deserve.
For example, a defender who makes a lot of tackles but then boots the ball out for a throw in is doing his job by stopping an attack, but a player who makes a lot of tackles then manages to start a sequence that leads to a shot is doing his job equally well, then also creating opportunities to counter attack. A defender who makes 20 tackles and initiates 15 sequences a match is more valuable than one who makes 20 tackles but only initiates 2 sequences.
No other metric would credit that defender with any sort of attacking contribution, yet he could be secretly invaluable in creating chances.
Opta and the Betting Industry

Many of Opta’s clients are in the gambling industry, and the company probably have more of an impact on your day to day betting than you realise.
They can provide all of the data and analytical information a bookie needs to make their own decisions on what represents fair value for the myriad betting markets on offer these days, but they can also provide engaging front end products for their punters.
Think of the stats tool many bookmakers provide, the live stats and match infographic that you often see in place of a live stream, or how predictions are made for fantasy football leagues – this is all made possible because of Opta or companies like them.
Even request a bet features could be using Opta’s data, because it gives the bookie a handy quick reference point on which to base the odds – it could even be automated with certain build a bet features.
Specialist promotions are made possible using Opta data too. During Euro 2020 Paddy Power ran a promotion for top goal scorer bettors whereby a free bet was credited for every shot on target by the chosen player. This was only possible because Opta could provide the data live allowing Paddy Power to automate the process of crediting free bets.
Arguably the most important element though, is the fact that Opta might have the final say on whether or not your bet is a winner. You will see in many bookmaker’s terms and conditions that they base their official decisions on those recorded by Opta.
There can be moments in sport when things are not clear, decisions are contested, and tempers flare. This can mean a final judgement difficult to make, but with an independent company taking the burden it keeps things fair.
This can impact certain betting markets though, for instance shots on target. What does and does not count as an official shot on target will be decided by Opta, and not the bookmaker. This means the bookie cannot be accused of cheating, but it also means the fate of your bet could be in Opta’s hands.
Opta have a page dedicated to what they call ‘event definitions’ which explains exactly how they decide what counts as what, so you can see how they come to their final conclusions.
So not only are Opta behind a lot of the cool features and in depth information available on betting sites, but they can make or break your bet as well.