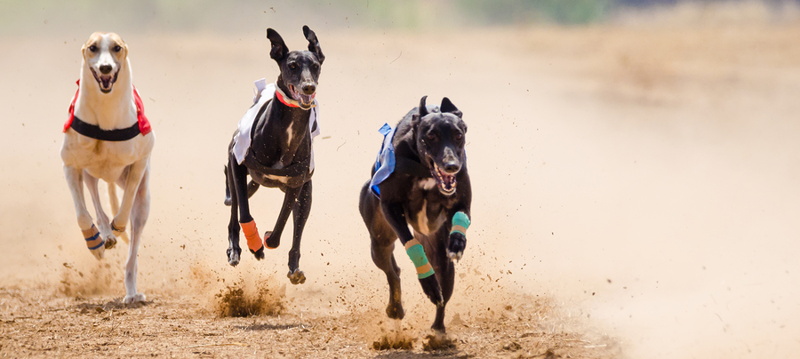
 Whilst the likes of horse racing and football will always be amongst the most popular sports to bet on in the United Kingdom, greyhound racing isn’t far behind. It is entirely reasonable to point out that going to the dogs isn’t anywhere near as popular as it was at its height, punters still enjoy placing a wager on greyhound races, either in-person or online.
Indeed, the very popularity of the sport is what allows the Bookmakers’ Afternoon Greyhound Service to exist, giving people even more races to bet on than ever before.
Being able to place a bet on the greyhounds isn’t the same as being able to win a bet on the greyhounds, though. Obviously there is no hard and fast way to consistently win greyhound races, otherwise we’d all be doing it.
One thing we can do, however, is to look at the number of times that the favourite ends up running out as the race winner. This will let us know whether or not we should be putting our money on the dogs that the bookies thing have got the best chance, or whether we should be looking further afield.
What The Stats Say
It is not an easy thing, to work out how many times the most favoured dog has been able to win the race that they’re taking part in. Thankfully, there are plenty of statistics out there that can help us to understand not only how often the favourite wins in greyhound races but also whether or not specific traps tend to favour the favourites at given courses.
We’re getting ahead of ourselves a little to talk about that, as to begin with we just want to have a look at the raw data to see how often the favourite at a greyhound venue wins.
In 2021, there were 18 greyhound stadiums in operation in the United Kingdom. Some of them, such as Crayford and Monmore, saw more races taking place at them than others. Even so, it is certainly the case that there was enough information available for us to look at the success of the favourites and come up with an answer to the question about how often they win.
Here’s a look at the information from the 18 courses, looking at how many favourites ran, how often they won and what percentage of winners were the favourite:
| Course | Number Of Favourites | Number Of Wins For Favourite | % Of Wins By Favourite |
|---|---|---|---|
| Central Park | 2650 | 955 | 36.00% |
| Crayford | 3227 | 1048 | 32.40% |
| Doncaster | 2231 | 754 | 33.70% |
| Harlow | 2715 | 756 | 27.80% |
| Henlow | 2769 | 990 | 35.70% |
| Hove | 2941 | 985 | 33.40% |
| Kinsley | 1669 | 488 | 29.20% |
| Monmore | 3294 | 1062 | 32.20% |
| Newcastle | 2601 | 840 | 32.20% |
| Nottingham | 1856 | 645 | 34.70% |
| Pelaw Grange | 464 | 150 | 32.30% |
| Perry Barr | 1970 | 663 | 33.60% |
| Romford | 2954 | 947 | 32.00% |
| Sheffield | 2489 | 935 | 37.50% |
| Sunderland | 2110 | 726 | 34.40% |
| Swindon | 2378 | 772 | 32.40% |
| Towcester | 1616 | 549 | 33.90% |
| Yarmouth | 1387 | 483 | 34.80% |
You can see that the average number of wins for favourites is in the 30% bracket, with 13,748 favourites winning from the 41,321races with favourites that took place across all 18 stadiums.
That works out as 33.27% of all favourites winning their race in 2021. The question is, does that remain a solid percentage if you look at a few other years?
Here’s the information for 2020 as a comparison, bearing in mind that there were 22 tracks open that year:
| Course | Number Of Favourites | Number Of Wins For Favourite | % Of Wins By Favourite |
|---|---|---|---|
| Belle Vue | 400 | 155 | 38.70% |
| Central Park | 2260 | 769 | 34.00% |
| Crayford | 2426 | 778 | 32.00% |
| Doncaster | 1797 | 577 | 32.10% |
| Harlow | 1946 | 541 | 27.80% |
| Henlow | 2895 | 967 | 33.40% |
| Hove | 2259 | 744 | 32.90% |
| Kinsley | 1475 | 444 | 30.10% |
| Monmore | 2686 | 873 | 32.50% |
| Newcastle | 2287 | 760 | 33.20% |
| Nottingham | 1691 | 589 | 34.80% |
| Pelaw Grange | 566 | 176 | 31.00% |
| Perry Barr | 1808 | 578 | 31.90% |
| Peterborough | 342 | 123 | 35.90% |
| Poole | 341 | 143 | 41.90% |
| Romford | 2432 | 839 | 34.40% |
| Shawfield | 85 | 33 | 38.80% |
| Sheffield | 2045 | 744 | 36.30% |
| Sunderland | 1956 | 657 | 33.50% |
| Swindon | 1740 | 564 | 32.40% |
| Towcester | 357 | 107 | 29.90% |
| Yarmouth | 1207 | 383 | 31.70% |
Across the 35,001 races that had a favourite in 2020, said favourite won the race on 11,544 occasions. That works out as 32.98% of the time that the favourite ended up as the race winner, which isn’t night and day from 2021.
In spite of their being more racecourses, there were fewer races taking place in 2020 on account of what was happening in the world at that time.
As a result of the slightly skewed data in 2020, it is worth having a look at 2019 as the last year when a full amount of races will have taken place, including those happening in front of crowds. Here’s how that worked out:
| Course | Number Of Favourites | Number Of Wins For Favourite | % Of Wins By Favourite |
|---|---|---|---|
| Belle Vue | 1732 | 597 | 34.40% |
| Central Park | 2655 | 925 | 348.00% |
| Crayford | 3050 | 980 | 32.10% |
| Doncaster | 2014 | 653 | 32.40% |
| Harlow | 2381 | 695 | 29.10% |
| Henlow | 3414 | 1113 | 32.60% |
| Hove | 2436 | 753 | 30.90% |
| Kinsley | 2388 | 656 | 27.40% |
| Monmore | 3484 | 1147 | 32.90% |
| Newcastle | 2744 | 913 | 33.20% |
| Nottingham | 2053 | 666 | 32.40% |
| Pelaw Grange | 1012 | 305 | 30.10% |
| Perry Barr | 2459 | 806 | 32.70% |
| Peterborough | 1636 | 539 | 32.90% |
| Poole | 1589 | 596 | 37.50% |
| Romford | 3014 | 941 | 31.20% |
| Shawfield | 657 | 234 | 35.60% |
| Sheffield | 2871 | 1021 | 35.50% |
| Sunderland | 2664 | 874 | 32.80% |
| Swindon | 1998 | 660 | 33.00% |
| Yarmouth | 1635 | 491 | 30.00% |
In 2019, there were 47,886 favourites running in Graded races at the 21 courses up and down the country.
Of those, 15,565 favourites went on to win the race that they were taking part in, which is 32.50% of races won by the favourite.
Here’s that information side-by-side for comparison:
| Year | Number Of Favourites | Number Of Times The Favourite Won | Average % Of Winners |
|---|---|---|---|
| 2021 | 41, 321 | 13,748 | 33.27% |
| 2020 | 35,001 | 11,544 | 32.98% |
| 2019 | 47,886 | 15,565 | 32.50% |
In other words, regardless of how many races are taking place around the United Kingdom, you can expect the favourite to win about a third of the time.
That is useful information to have if you’re considering betting on a race and wanting to know whether to go along with the bookmaker’s suggestion.
Do Traps Make A Difference?
You can often read information from tipsters around the idea of traps being influential on the outcome of a race.
When it comes to how successful the favourites are, is that actually true?
Once again, we can look at the data to see how often the favourite wins when they start in a given trap at the courses around the United Kingdom, so let’s start by looking at exactly that information for 2021:
| Stadium | Trap 1 Favourites | Trap 1 Favourite Winners | Trap 1 Favourite Win % | Trap 2 Favourites | Trap 2 Favourite Winners | Trap 2 Favourite Win % | Trap 3 Favourites | Trap 3 Favourite Winners | Trap 3 Favourite Win % | Trap 4 Favourites | Trap 4 Favourite Winners | Trap 4 Favourite Win % | Trap 5 Favourites | Trap 5 Favourite Winners | Trap 5 Favourite Win % | Trap 6 Favourites | Trap 6 Favourite Winners | Trap 6 Favourite Win % |
|---|---|---|---|---|---|---|---|---|---|---|---|---|---|---|---|---|---|---|
| Central Park | 487 | 163 | 33.5% | 403 | 132 | 32.8% | 479 | 184 | 38.4% | 370 | 137 | 37.0% | 323 | 113 | 35.0% | 588 | 226 | 38.4% |
| Crayford | 605 | 187 | 30.9% | 509 | 170 | 33.4% | 491 | 146 | 29.7% | 520 | 178 | 34.2% | 440 | 145 | 33.0% | 662 | 222 | 33.5% |
| Doncaster | 445 | 143 | 32.1% | 352 | 132 | 37.5% | 393 | 121 | 30.8% | 315 | 95 | 30.2% | 238 | 82 | 34.5% | 488 | 181 | 37.1% |
| Harlow | 523 | 140 | 26.8% | 423 | 134 | 31.7% | 418 | 97 | 23.2% | 416 | 117 | 28.1% | 351 | 109 | 31.1% | 584 | 159 | 27.2% |
| Henlow | 628 | 216 | 34.4% | 469 | 172 | 36.7% | 503 | 190 | 37.8% | 398 | 139 | 34.9% | 332 | 118 | 35.5% | 439 | 155 | 35.3% |
| Hove | 608 | 201 | 33.1% | 602 | 219 | 36.4% | 476 | 155 | 32.6% | 412 | 137 | 33.3% | 330 | 99 | 30.0% | 513 | 174 | 33.9% |
| Kinsley | 268 | 82 | 30.6% | 229 | 63 | 27.5% | 327 | 119 | 36.4% | 294 | 83 | 28.2% | 248 | 63 | 25.4% | 303 | 78 | 25.7% |
| Monmore | 589 | 201 | 34.1% | 559 | 180 | 32.2% | 604 | 180 | 29.8% | 523 | 161 | 30.8% | 457 | 161 | 35.2% | 562 | 179 | 31.9% |
| Newcastle | 401 | 113 | 28.2% | 419 | 141 | 33.7% | 517 | 172 | 33.3% | 460 | 169 | 36.7% | 281 | 98 | 34.9% | 523 | 147 | 28.1% |
| Nottingham | 293 | 104 | 35.5% | 309 | 110 | 35.6% | 340 | 113 | 33.2% | 315 | 115 | 36.5% | 234 | 77 | 32.9% | 365 | 126 | 34.5% |
| Pelaw Grange | 108 | 36 | 33.3% | 89 | 31 | 34.8% | 73 | 20 | 27.4% | 68 | 22 | 32.4% | 61 | 28 | 45.9% | 65 | 13 | 20.0% |
| Perry Barr | 420 | 133 | 31.7% | 354 | 119 | 33.6% | 332 | 111 | 33.4% | 283 | 106 | 37.5% | 236 | 81 | 34.3% | 345 | 113 | 32.8% |
| Romford | 535 | 170 | 31.8% | 563 | 170 | 30.2% | 501 | 175 | 34.9% | 439 | 143 | 32.6% | 384 | 114 | 29.7% | 532 | 175 | 32.9% |
| Sheffield | 547 | 189 | 34.6% | 454 | 184 | 40.5% | 477 | 199 | 41.7% | 398 | 154 | 38.7% | 227 | 72 | 31.7% | 386 | 137 | 35.5% |
| Sunderland | 433 | 142 | 32.8% | 378 | 123 | 32.5% | 399 | 136 | 34.1% | 365 | 148 | 40.5% | 221 | 77 | 34.8% | 314 | 100 | 31.8% |
| Swindon | 419 | 130 | 31.0% | 392 | 135 | 34.4% | 435 | 132 | 30.3% | 368 | 129 | 35.1% | 280 | 86 | 30.7% | 484 | 160 | 33.1% |
| Towcester | 328 | 118 | 36.0% | 301 | 101 | 33.6% | 358 | 126 | 35.2% | 250 | 81 | 32.4% | 134 | 43 | 32.1% | 245 | 80 | 32.7% |
| Yarmouth | 229 | 71 | 31.0% | 235 | 82 | 34.9% | 333 | 128 | 38.4% | 281 | 114 | 40.6% | 152 | 40 | 26.3% | 157 | 48 | 30.6% |
You can clearly see how different traps become relevant at different stadiums, such as the 40.6% of winners from trap 4 at Yarmouth, compared to the 26.3% of winning favourites from trap 5.
To put it another way, if you were thinking of betting on the favourite at Yarmouth in 2021, you’d have been more than 14% more likely to win your bet if the favourite had been starting in trap 4 than trap 5.
Does that same degree of information carry across to 2020?
Here’s a look at the stadiums that were open then:
| Stadium | Trap 1 Favourites | Trap 1 Favourite Winners | Trap 1 Favourite Win % | Trap 2 Favourites | Trap 2 Favourite Winners | Trap 2 Favourite Win % | Trap 3 Favourites | Trap 3 Favourite Winners | Trap 3 Favourite Win % | Trap 4 Favourites | Trap 4 Favourite Winners | Trap 4 Favourite Win % | Trap 5 Favourites | Trap 5 Favourite Winners | Trap 5 Favourite Win % | Trap 6 Favourites | Trap 6 Favourite Winners | Trap 6 Favourite Win % |
|---|---|---|---|---|---|---|---|---|---|---|---|---|---|---|---|---|---|---|
| Belle Vue | 67 | 18 | 26.9% | 87 | 42 | 48.3% | 67 | 23 | 34.3% | 62 | 30 | 48.4% | 60 | 20 | 33.3% | 57 | 22 | 38.6% |
| Central Park | 471 | 148 | 31.4% | 356 | 126 | 35.4% | 427 | 165 | 38.6% | 361 | 127 | 35.2% | 248 | 76 | 30.6% | 394 | 127 | 32.2% |
| Crayford | 453 | 145 | 32.0% | 419 | 137 | 32.7% | 419 | 140 | 33.4% | 339 | 109 | 32.2% | 315 | 101 | 32.1% | 474 | 146 | 30.8% |
| Doncaster | 310 | 98 | 31.6% | 272 | 73 | 26.8% | 335 | 103 | 30.7% | 303 | 123 | 40.6% | 233 | 73 | 31.3% | 339 | 107 | 31.6% |
| Harlow | 340 | 99 | 29.1% | 284 | 76 | 26.8% | 385 | 101 | 26.2% | 312 | 82 | 26.3% | 234 | 74 | 31.6% | 389 | 109 | 28.0% |
| Henlow | 618 | 226 | 36.6% | 461 | 154 | 33.4% | 520 | 191 | 36.7% | 422 | 128 | 30.3% | 390 | 100 | 25.6% | 482 | 168 | 34.9% |
| Hove | 486 | 176 | 36.2% | 412 | 143 | 34.7% | 353 | 99 | 28.0% | 310 | 89 | 28.7% | 290 | 91 | 31.4% | 403 | 146 | 36.2% |
| Kinsley | 276 | 72 | 26.1% | 232 | 65 | 28.0% | 299 | 104 | 34.8% | 279 | 88 | 31.5% | 165 | 50 | 30.3% | 219 | 65 | 29.7% |
| Monmore | 452 | 165 | 36.5% | 416 | 134 | 32.2% | 522 | 173 | 33.1% | 390 | 122 | 31.3% | 388 | 118 | 30.4% | 506 | 161 | 31.8% |
| Newcastle | 349 | 118 | 33.8% | 395 | 111 | 28.1% | 510 | 166 | 32.5% | 407 | 146 | 35.9% | 284 | 108 | 38.0% | 342 | 111 | 32.5% |
| Nottingham | 270 | 84 | 31.1% | 308 | 124 | 40.3% | 319 | 124 | 38.9% | 258 | 91 | 35.3% | 207 | 68 | 32.9% | 326 | 98 | 30.1% |
| Pelaw Grange | 127 | 39 | 30.7% | 93 | 26 | 28.0% | 78 | 26 | 33.3% | 70 | 22 | 31.4% | 83 | 21 | 25.3% | 115 | 42 | 36.5% |
| Perry Barr | 356 | 118 | 33.1% | 342 | 100 | 29.2% | 301 | 105 | 34.9% | 298 | 95 | 31.9% | 215 | 71 | 33.0% | 293 | 89 | 30.4% |
| Peterborough | 77 | 23 | 29.9% | 61 | 29 | 47.5% | 61 | 26 | 42.6% | 62 | 21 | 33.9% | 33 | 12 | 36.4% | 48 | 12 | 25.0% |
| Poole | 62 | 29 | 46.8% | 74 | 30 | 40.5% | 57 | 29 | 50.9% | 56 | 25 | 44.6% | 55 | 18 | 32.7% | 37 | 12 | 32.4% |
| Romford | 485 | 183 | 37.7% | 487 | 164 | 33.7% | 432 | 134 | 31.0% | 328 | 110 | 33.5% | 277 | 104 | 37.5% | 419 | 144 | 34.4% |
| Shawfield | 17 | 4 | 23.5% | 8 | 2 | 25.0% | 21 | 9 | 42.9% | 16 | 8 | 50.0% | 23 | 10 | 43.5% | 0 | 0 | 0.0% |
| Sheffield | 433 | 159 | 36.7% | 357 | 121 | 33.9% | 409 | 144 | 35.2% | 288 | 96 | 33.3% | 240 | 101 | 42.1% | 315 | 123 | 39.0% |
| Sunderland | 385 | 141 | 36.6% | 346 | 116 | 33.5% | 394 | 121 | 30.7% | 280 | 110 | 39.3% | 217 | 68 | 31.3% | 320 | 101 | 31.6% |
| Swindon | 290 | 102 | 35.2% | 237 | 92 | 38.8% | 371 | 118 | 31.8% | 277 | 76 | 27.4% | 240 | 69 | 28.8% | 321 | 107 | 33.3% |
| Towcester | 84 | 21 | 25.0% | 50 | 20 | 40.0% | 82 | 27 | 32.9% | 62 | 16 | 25.8% | 34 | 10 | 29.4% | 45 | 13 | 28.9% |
| Yarmouth | 182 | 50 | 27.5% | 226 | 67 | 29.6% | 239 | 74 | 31.0% | 249 | 90 | 36.1% | 122 | 42 | 34.4% | 181 | 60 | 33.1% |
If we continue looking at Yarmouth as our example course, you can see that the trip still has an influence and that trap 4 is still the best one for a favourite to run out of, the actually percentage of trap 4 winners has dropped from 40.6% to 36.1%.
It is also interesting to note that, in 2020, trap 5 wasn’t the trap to avoid if you were the favourite but rather trap 1, closely followed by trap 2.
Finally, does the same sort of thing for the traps at the various courses hold true in 2019, when all courses were open for most of the year?
| Stadium | Trap 1 Favourites | Trap 1 Favourite Winners | Trap 1 Favourite Win % | Trap 2 Favourites | Trap 2 Favourite Winners | Trap 2 Favourite Win % | Trap 3 Favourites | Trap 3 Favourite Winners | Trap 3 Favourite Win % | Trap 4 Favourites | Trap 4 Favourite Winners | Trap 4 Favourite Win % | Trap 5 Favourites | Trap 5 Favourite Winners | Trap 5 Favourite Win % | Trap 6 Favourites | Trap 6 Favourite Winners | Trap 6 Favourite Win % |
|---|---|---|---|---|---|---|---|---|---|---|---|---|---|---|---|---|---|---|
| Belle Vue | 297 | 91 | 30.6% | 295 | 109 | 36.9% | 287 | 101 | 35.2% | 343 | 121 | 35.3% | 297 | 105 | 35.4% | 213 | 70 | 32.9% |
| Central Park | 568 | 190 | 33.5% | 401 | 136 | 33.9% | 495 | 179 | 36.2% | 379 | 133 | 35.1% | 284 | 85 | 29.9% | 519 | 202 | 38.9% |
| Crayford | 621 | 189 | 30.4% | 457 | 151 | 33.0% | 529 | 165 | 31.2% | 446 | 156 | 35.0% | 376 | 122 | 32.4% | 602 | 197 | 32.7% |
| Doncaster | 361 | 131 | 36.3% | 304 | 97 | 31.9% | 402 | 135 | 33.6% | 331 | 94 | 28.4% | 240 | 63 | 26.3% | 376 | 133 | 35.4% |
| Harlow | 428 | 112 | 26.2% | 367 | 107 | 29.2% | 410 | 138 | 33.7% | 361 | 94 | 26.0% | 274 | 67 | 24.5% | 531 | 177 | 33.3% |
| Henlow | 731 | 268 | 36.7% | 629 | 201 | 32.0% | 585 | 171 | 29.2% | 519 | 186 | 35.8% | 391 | 112 | 28.6% | 542 | 175 | 32.3% |
| Hove | 531 | 179 | 33.7% | 459 | 145 | 31.6% | 367 | 106 | 28.9% | 372 | 104 | 28.0% | 265 | 81 | 30.6% | 427 | 138 | 32.3% |
| Kinsley | 354 | 90 | 25.4% | 353 | 78 | 22.1% | 463 | 140 | 30.2% | 391 | 125 | 32.0% | 399 | 125 | 31.3% | 404 | 98 | 24.3% |
| Monmore | 494 | 158 | 32.0% | 568 | 187 | 32.9% | 740 | 253 | 34.2% | 553 | 180 | 32.5% | 500 | 176 | 35.2% | 612 | 193 | 31.5% |
| Newcastle | 393 | 118 | 30.0% | 449 | 141 | 31.4% | 575 | 226 | 39.3% | 489 | 153 | 31.3% | 326 | 99 | 30.4% | 511 | 176 | 34.4% |
| Nottingham | 384 | 142 | 37.0% | 341 | 87 | 25.5% | 405 | 138 | 34.1% | 332 | 107 | 32.2% | 236 | 78 | 33.1% | 348 | 114 | 32.8% |
| Pelaw Grange | 181 | 55 | 30.4% | 172 | 63 | 36.6% | 169 | 41 | 24.3% | 158 | 51 | 32.3% | 156 | 33 | 21.2% | 176 | 62 | 35.2% |
| Perry Barr | 507 | 172 | 33.9% | 420 | 136 | 32.4% | 404 | 117 | 29.0% | 406 | 141 | 34.7% | 327 | 110 | 33.6% | 391 | 130 | 33.2% |
| Peterborough | 301 | 100 | 33.2% | 337 | 107 | 31.8% | 286 | 99 | 34.6% | 304 | 107 | 35.2% | 184 | 59 | 32.1% | 217 | 67 | 30.9% |
| Poole | 248 | 96 | 38.7% | 329 | 129 | 39.2% | 304 | 104 | 34.2% | 229 | 101 | 44.1% | 241 | 76 | 31.5% | 233 | 90 | 38.6% |
| Romford | 596 | 208 | 34.9% | 655 | 204 | 31.1% | 508 | 170 | 33.5% | 409 | 116 | 28.4% | 414 | 121 | 29.2% | 432 | 122 | 28.2% |
| Shawfield | 205 | 67 | 32.7% | 137 | 57 | 41.6% | 118 | 43 | 36.4% | 130 | 41 | 31.5% | 58 | 24 | 41.4% | 9 | 2 | 22.2% |
| Sheffield | 525 | 196 | 37.3% | 543 | 189 | 34.8% | 557 | 194 | 34.8% | 462 | 175 | 37.9% | 339 | 111 | 32.7% | 439 | 156 | 35.5% |
| Sunderland | 472 | 156 | 33.1% | 420 | 144 | 34.3% | 517 | 162 | 31.3% | 430 | 137 | 31.9% | 332 | 109 | 32.8% | 463 | 166 | 35.9% |
| Swindon | 315 | 95 | 30.2% | 310 | 114 | 36.8% | 412 | 131 | 31.8% | 308 | 100 | 32.5% | 291 | 91 | 31.3% | 359 | 129 | 35.9% |
| Yarmouth | 233 | 79 | 33.9% | 248 | 79 | 31.9% | 341 | 105 | 30.8% | 310 | 99 | 31.9% | 222 | 57 | 25.7% | 277 | 72 | 26.0% |
If we continue to use Yarmouth as our main point of reference, you can see that trap 1 was the best trap to bet on the favourite with in 2019, given that the favourite won 33.9% of their races starting in that trap.
That compares with 25.7% of the time that the favourite won when starting in trap 5.