 Football fans will always be convinced that their team is hard done to, whilst other sides get away with murder. Don’t forget that Leeds United have long had a reputation of being one of the dirtiest teams around, even being referred to as ‘dirty, dirty Leeds’, yet their supporters will always exclaim the side’s innocence.
The obvious questions that come up are firstly whether there’s much truth in the idea of one team or a player being dirtier than another and secondly whether there’s any way to actually tell.
This is an important factor in modern betting too as you can now wager on players to be booked along with team booking points and therefore knowing what teams and players are dirtier than others can be highly useful information. It is also important to consider for other bets, such as goalscorer, etc., as a player can’t score if they’ve been sent off!
Anyone who watches the modern game will tell you that certain players (Fernandinho at ManCity was a good example), regularly get away with a whole host of fouls without being punished for them by the match referee, so do yellow and red cards give us a fair reflection of how ‘dirty’ a player is?
Having a good idea of which players are the most likely to get booked and which teams are most commonly punished for their play with bookings and sending off can help when it comes to placing bets on booking points, yellow cards and sendings off.
That’s what we’ll try to do here.
Player Bookings
 The problem with stats and information on bookings is that they change all of the time. Games take place virtually every week between August and May, sometimes twice a week.
With that in mind, the notion of bookings, sending offs and ‘dirty’ play is difficult to track with any sense of immediacy.
Even so, knowing which players have been shown the most yellow cards in the history of the top-flight offers some insight into the sort of players that tend to find themselves in the referee’s bad books.
The table below looks at the players that were booked most between the start of the Premier League in 1992 and December 2021.
| Player | Team / Teams Played For | Bookings |
|---|---|---|
| Cesc Fabregas | Arsenal, Chelsea | 71 |
| Richard Dunne | Everton, Manchester City, Aston Villa, Queens Park Rangers | 74 |
| Paul Ince | West Ham United, Manchester United, Liverpool, Middlesbrough, Wolverhampton Wanderers | 74 |
| Gavin McCann | Everton, Sunderland, Aston Villa, Bolton | 75 |
| Patrick Viera | Arsenal, Manchester City | 76 |
| Nicky Butt | Manchester United, Newcastle United, Birmingham City | 77 |
| Joey Barton | Manchester City, Newcastle United, Queens Park Rangers, Burnley | 78 |
| Phil Bardsley | Manchester United, Aston Villa, Sunderland, Stoke City, Burnley | 79 |
| Phil Neville | Manchester United, Everton | 82 |
| Mark Noble | West Ham | 82 |
| Kevin Nolan | Bolton Wanderers, Newcastle United, West Ham United | 85 |
| George Boateng | Coventry City, Aston Villa, Middlesbrough, Hull City | 85 |
| Lee Cattermole | Middlesbrough, Wigan Athletic, Sunderland | 88 |
| Robbie Savage | Leicester City, Birmingham City, Blackburn Rovers, Derby County | 89 |
| Scott Parker | Chelsea, Newcastle United, West Ham United, Tottenham Hotspur, Fulham | 92 |
| Paul Scholes | Manchester United | 97 |
| Kevin Davies | Bolton Wanderers | 99 |
| Lee Bowyer | Leeds United, Newcastle United, Birmingham City, West Ham United | 99 |
| Wayne Rooney | Everton, Manchester United | 102 |
| Gareth Barry | Aston Villa, Everton, Manchester City, West Bromwich Albion | 123 |
Dirtiest Players Mostly Midfielders
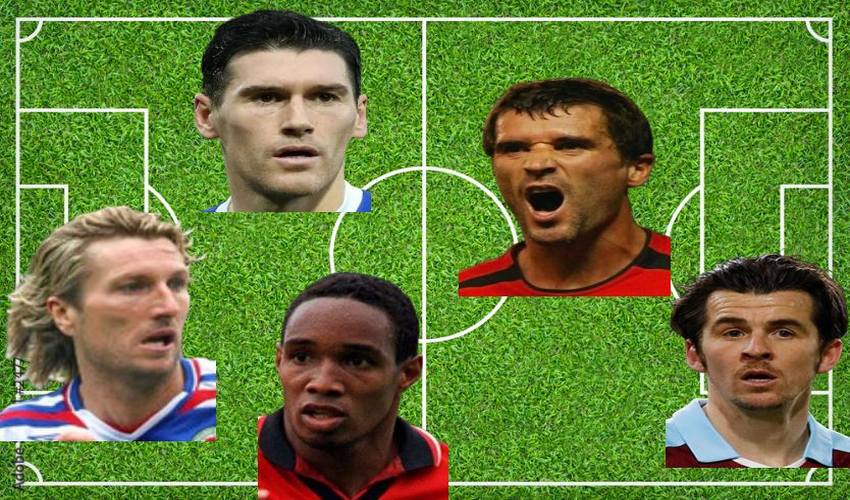
Perhaps the most interesting thing to note from that list is that there are very few defenders on it. Given that the backline is the last line of defence, quite literally, you’d be forgiven for thinking that defenders would pick up a high amount of bookings, but they don’t.
Instead, it is the midfield enforcers that sit alongside each other in the top 20. It’s no surprise to see names like Robbie Savage, Paul Ince and Gareth Barry on there, knowing that they all had reputations as being rather dirty in their day. It’s also interesting that none of them were ever the fastest of midfielders, which is perhaps something to bear in mind.
When you’re looking at a match and considering who might get booked, perhaps have a think about whether the player is known as being the ‘enforcer’ for either side. Also think about whether they might be starting to slow down as they get older – do they have too many games in their legs? That’s probably why the likes of Wayne Rooney makes it onto the list despite being a striker.
Red Cards
 Red cards are different from yellow cards, both in real terms and when it comes to your betting. Two yellows make a red, so some of the players that have been shown the most yellow cards will have seen a red or two brandished in their direction, of course.
Even so, the table below shows who are the players that have seen red the most between the Premier League’s foundation and December 2021.
This time there is a decent mix of players from defence, midfield and attack, though it’s once again populated by the sort of players that you’d expect to see in there. Self-proclaimed hardmen like Vinnie Jones and Duncan Ferguson are in there, as well as central defenders like Nemanja Vidic, who will have been the last man a few times.
It’s also notable that, as suspected, some of the players that were on the yellow card list, like Patrick Viera and Joey Barton, have also been shown more than a couple of red cards during their careers.
| Player | Teams | Red Cards |
|---|---|---|
| Joey Barton | Manchester City, Newcastle United, Queens Park Rangers, Burnley | 6 |
| Franck Queudrue | Middlesborough, Fulham, Birmingham City | 6 |
| John Hartson | Arsenal, West Ham United, Wimbledon, Coventry City | 6 |
| Younes Kaboul | Watford, Portsmouth, Tottenham Hotspur, Sunderland | 6 |
| Nemanja Vidic | Manchester United | 6 |
| Roy Keane | Manchester United | 7 |
| Lee Cattermole | Middlesbrough, Wigan Athletic, Sunderland | 7 |
| Alan Smith | Leeds United, Manchester United, Newcastle United | 7 |
| Vinnie Jones | Wimbledon | 7 |
| Partrick Viera | Arsenal, Manchester City | 8 |
| Duncan Ferguson | Everton | 8 |
| Richard Dunne | Everton, Manchester City, Aston Villa, Queens Park Rangers | 8 |
Teams Bookings
 One of the standout things from the lists above is the number of teams that are on them more than once. In many instances it’s teams that often tend to be in relegation battles, such as Middlesbrough, Queens Park Rangers and Everton. There are more than a few of the most successful teams on the list, though, with Manchester United featuring a few times.
Between the competition’s opening season in 1992 and the end of the 2018-2019 campaign, 49 teams have plied their trade in the Premier League. Obviously it goes without saying that the teams that have been in the division for the longest, such as Everton and Manchester United, are more likely to have received more cards than the teams that have only played a couple of seasons in the top-flight.
Where teams fit into the list depends on whether you’re looking at the total number of cards received or the average number of cards per game played. For example, Liverpool have quite a high number of cards against their name, but the average number of cards per game is actually quite low because of how many Premier League games the Merseyside club have played over the years.
The table below looks at the top 10 according to the number of booking points received by a team:
| Team | Games Played | Booking Points Received |
|---|---|---|
| Chelsea | 1046 | 18360 |
| Everton | 1046 | 18245 |
| Arsenal | 1046 | 17885 |
| Tottenham Hotspur | 1046 | 16815 |
| Manchester United | 1046 | 16570 |
| West Ham United | 890 | 16495 |
| Newcastle United | 928 | 15495 |
| Aston Villa | 932 | 15175 |
| Liverpool | 1046 | 14530 |
| Manchester City | 856 | 14430 |
From that list you’d imagine that the teams on it are the most dirty that the Premier League has seen, but it goes without saying that the more games you play the more likely you are to get a booking or a sending off.
Because of that, the table offers a skewed sense of whether or not teams are actually all that dirty. You might be tempted to stick a bet on there being loads of cards in a match between Chelsea and Everton, say, but you might well be mistaken to do so.
In order to get a better idea of which teams are liable to receive booking points during one off matches, it makes more sense to look at the top ten teams for booking points per match played.
Here’s the top ten for your consideration:
| Team | Number Of Games | Average Number Of Booking Points Per Game Played |
|---|---|---|
| Derby County | 266 | 21.82 |
| Sunderland | 608 | 20.55 |
| Hull City | 190 | 20.42 |
| Watford | 236 | 20.33 |
| Barnsley | 38 | 20.00 |
| Stoke City | 380 | 19.90 |
| Bolton Wanderers | 494 | 19.33 |
| Wigan Athletic | 304 | 19.06 |
| Wolverhampton Wanderers | 198 | 18.91 |
| Middlesbrough | 574 | 18.91 |
The interesting thing about this list is that none of the teams in the first list are on it. That might be linked to the fact that most, if not all, of the sides listed here have endured a mixed relationship with the Premier League. All of them have been relegated out of at one point or another and only Watford are still in the top-flight as of the 2019-2020 campaign.
It’s suggestive of teams that need to battle for their survival being the most likely to foul and give away free-kicks or penalties. The result of that is that sides tend to player closer to the edge and are therefore more likely to pick up booking points.
If you’re thinking of placing a bet on how many bookings there’ll be in a match or how many points will be racked up then it’s worth having a look at if there’s a decent combination of teams struggling for survival with combative players in their ranks. If a player has a hot-head in the mould of Wayne Rooney or Duncan Ferguson then it’s even more noteworthy ahead of your betting.
Booking Points Explained
 At this point it’s worth offering a quick explanation of Booking Points and how they work.
Booking Points is a system that is used by bookmakers in which a given number of points is awarded depending on whether a player is booked or sent off.
If a player is shown a yellow card then they usually receive 10 points. If they are shown a straight red card then they get 25 points. If they are shown two yellows and a red then they are awarded 35 points.
Some bookmakers use a different system, in which players will be awarded 1 point, 2 points or 3 points accordingly. Generally, though, it’s the 10, 25 and 35 system that they use.
You can bet on how many Booking Points will be given during a match, so the information on this page should serve you well on that front.
Do Bookings And Free-Kicks Always Mean A Team Is Dirty?

There is always a temptation to assume that free-kicks given away in a match or bookings and red cards received naturally means that a team is dirty. That isn’t always the case, however. For proof, it’s worth having a look at Jürgen Klopp’s Liverpool team.
During the four seasons or so that the German was in charge of the Merseyside club between October 2015 and May 2019, they scored the lowest number of points of all twenty teams each campaign. The former Borussia Dortmund manager clearly believes that not playing dirty is the best way to succeed.
Yet during the match between Liverpool and Manchester United at Old Trafford in October of 2019, Liverpool were adjudged to have committed more fouls than the home side by referee Martin Atkinson. The away team conceded 14 free-kicks compared to United’s 6, in spite of the fact that Liverpool had just shy of 68% of possession.
If Liverpool weren’t all that dirty in the game, and it would have been difficult to be considering how much of the ball they had, what was the factor that meant the Reds were on the receiving end of more whistle blows and bookings than the home team?
The referee. There’s no suggestion that Martin Atkinson was biased against Liverpool or in favour of Manchester United, it’s simply a fact that the man in the middle can have more of an affect on the outcome of the game than people realise. Sometimes referees unconsciously govern with a narrative in their mind, determined not to be influenced by the crowd or ‘fooled’ by a player with a reputation for simulation.
Obviously this can then influence how they govern the match. It’s one of the key factors that you should think about before you go to place any bets. Does the match referee have a tendency to give more or less cards than other officials? Thankfully the Premier League’s website is an excellent resource for finding out such information, so make sure you use it.
If there’s a combination of players that tend to get booked or sent off regularly and a referee that is liberally with his bookings then that naturally leads towards an obvious decision when it comes to what to bet on.
How Bookings Have Changed Over The Years
It’s an obvious question to ask, but have bookings changed much over the years?
That is to say, was there an era in the Premier League when players were at their dirtiest in terms of the number of bookings and red cards that they were shown?
The table below looks at the most yellow and red cards that a player has received across the course of each season, as well as how many players were shown that many of the cards.
| Season | Number Of Yellow | Players Booked That Often | Number Of Red | Players Sent Off That Often |
|---|---|---|---|---|
| 1992-1993 | 8 | 7 | 2 | 2 |
| 1993-1994 | 10 | 1 | 2 | 2 |
| 1994-1995 | 12 | 3 | 2 | 5 |
| 1995-1996 | 11 | 1 | 3 | 1 |
| 1996-1997 | 11 | 6 | 2 | 4 |
| 1997-1998 | 11 | 1 | 3 | 2 |
| 1998-1999 | 14 | 1 | 2 | 5 |
| 1999-2000 | 13 | 2 | 2 | 7 |
| 2000-2001 | 13 | 1 | 2 | 4 |
| 2001-2002 | 14 | 1 | 3 | 1 |
| 2002-2003 | 12 | 2 | 3 | 1 |
| 2003-2004 | 13 | 2 | 2 | 4 |
| 2004-2005 | 10 | 2 | 2 | 4 |
| 2005-2006 | 11 | 1 | 2 | 3 |
| 2006-2007 | 13 | 1 | 2 | 3 |
| 2007-2008 | 13 | 1 | 2 | 3 |
| 2008-2009 | 12 | 1 | 2 | 7 |
| 2009-2010 | 11 | 2 | 2 | 6 |
| 2010-2011 | 14 | 1 | 2 | 5 |
| 2011-2012 | 11 | 1 | 2 | 4 |
| 2012-2013 | 10 | 4 | 2 | 2 |
| 2013-2014 | 11 | 1 | 3 | 1 |
| 2014-2015 | 14 | 1 | 2 | 5 |
| 2015-2016 | 11 | 1 | 3 | 1 |
| 2016-2017 | 14 | 1 | 2 | 3 |
| 2017-2018 | 11 | 1 | 2 | 2 |
| 2018-2019 | 14 | 1 | 2 | 2 |
| 2019-2020 | 12 | 1 | 2 | 3 |
| 2020-2021 | 12 | 1 | 2 | 1 |
| 2021-2022 | 10 | 2 | 2 | 2 |
As you can see, the fewest yellow cards dished out to a player during the season is 10 and the most is 14. It’s interesting to note that in all but two of the season when 14 yellow cards were shown, 5 players were also sent off.
It’s suggestive of a season in which either players were more likely to engage in violent play or else referees were more card happy than in previous seasons. That’s backed up by seasons in which the fewest yellow cards were shown also being ones in which only 2 red cards were shown to the same players over the course of a campaign.
It’s far from a perfect system, but the Premier League’s website is kept up to date during seasons when it comes to cards shown, so it’s worth having a look to see if referees appear to be card happy during the campaign before you place any bets.