 In football, goals are the real currency. Even when a defence is spoken about in reverential terms, it is due to how few goals the defenders and goalkeeper have conceded.
You can lose a match without scoring a goal but you can never win one, so putting the ball in the back of the net is the most crucial thing that a football team can work together to figure out how to do.
In the world of betting, you can opt to place a wager on a whole host of things that might happen in a ten minute period of a football match.
Obviously one of those things is when a goal might be scored, with many bookies breaking the options down into ten minute chunks.
Here we’ll have a look at the time during a match when the most goals are scored and conceded.
2018-2019 Premier League Season
| Team | 0-10 | 11-20 | 21-30 | 31-40 | 41-50 | 51-60 | 61-70 | 71-80 | 81-90+ |
|---|---|---|---|---|---|---|---|---|---|
| Arsenal | 6-3 | 9-7 | 8-5 | 2-5 | 8-9 | 10-1 | 10-12 | 7-1 | 13-8 |
| Bournemouth | 3-4 | 7-8 | 4-7 | 7-11 | 10-7 | 4-8 | 3-8 | 7-6 | 11-11 |
| Brighton & Hove Albion | 2-4 | 3-2 | 6-9 | 3-8 | 4-8 | 3-5 | 6-9 | 5-9 | 3-6 |
| Burnley | 5-7 | 5-10 | 3-6 | 8-5 | 3-4 | 5-7 | 4-10 | 4-4 | 8-15 |
| Cardiff City | 2-6 | 3-8 | 3-5 | 2-6 | 4-5 | 3-7 | 4-12 | 4-3 | 9-16 |
| Chelsea | 3-3 | 7-6 | 5-3 | 6-3 | 7-5 | 8-9 | 6-3 | 6-4 | 15-3 |
| Crystal Palace | 1-1 | 3-2 | 3-3 | 10-4 | 5-7 | 3-9 | 7-8 | 8-8 | 11-11 |
| Everton | 5-2 | 8-2 | 5-3 | 5-6 | 4-9 | 5-5 | 8-10 | 6-5 | 8-4 |
| Fulham | 3-7 | 2-11 | 1-15 | 5-3 | 6-7 | 4-5 | 5-8 | 6-10 | 2-15 |
| Huddersfield Town | 4-6 | 1-9 | 2-9 | 3-7 | 1-10 | 4-4 | 2-7 | 1-13 | 4-11 |
| Leicester City | 1-8 | 4-5 | 5-1 | 3-7 | 4-6 | 7-4 | 5-7 | 8-1 | 14-9 |
| Liverpool | 6-2 | 10-2 | 11-2 | 4-3 | 12-1 | 7-2 | 12-3 | 8-3 | 19-4 |
| Manchester City | 12-0 | 13-2 | 8-3 | 9-3 | 13-3 | 12-3 | 12-4 | 6-2 | 10-3 |
| Manchester United | 6-3 | 5-6 | 9-9 | 9-1 | 7-7 | 6-7 | 5-7 | 8-7 | 10-7 |
| Newcastle United | 5-5 | 5-6 | 7-4 | 5-3 | 2-5 | 4-4 | 5-3 | 1-6 | 8-12 |
| Southampton | 3-5 | 8-6 | 4-6 | 3-7 | 7-6 | 7-12 | 3-5 | 5-4 | 5-14 |
| Tottenham Hotspur | 6-3 | 4-4 | 11-1 | 5-2 | 7-1 | 8-6 | 8-4 | 8-8 | 10-10 |
| Watford | 5-4 | 5-6 | 4-3 | 3-10 | 4-7 | 4-5 | 12-3 | 7-12 | 8-9 |
| West Ham United | 3-5 | 6-6 | 6-6 | 5-3 | 6-6 | 3-7 | 10-5 | 6-6 | 7-11 |
| Wolverhampton Wanderers | 2-5 | 7-7 | 3-8 | 1-1 | 4-4 | 5-2 | 6-5 | 8-7 | 11-7 |
| Overall Totals | 166 | 244 | 216 | 196 | 235 | 224 | 266 | 238 | 372 |
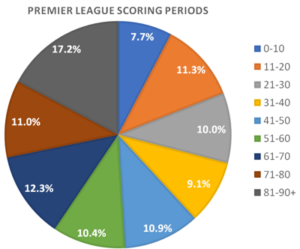
| Total Percentage | 7.7% | 11.3% | 10.0% | 9.1% | 10.9% | 10.4% | 12.3% | 11.0% | 17.2% |
 There are a number of things that can affect the times that a goal might be scored in. Some competitions are more goal heavy than others, for example, whilst if a side is going up against a weaker opposition then they’ll be more likely to score more often. The best thing that we can do is look at a prolonged period of time in one competition to remove those variables.
Let’s start by having a look at the 2018-2019 Premier League Season and the number of goals scored and conceded by each team in each ten minute period (table above). The goals scored will be first and conceded second, with all information taken from Soccer Stats.
It is a widely acknowledged fact of football that the first goals are scored in the opening and closing 5 minutes of each half. What the table above shows us is that the most goals are scored in the closing 10 minutes of the second-half, followed by the 10 minutes that come after the hour mark. Something that is very much worth noting in terms of betting strategies. It is of course worth noting that the 41-50 and 81-90+ periods have more than 10 minutes due to added time, which is varies in each match.
As a comparison, here are some similar stats from the 2021/2022 season, broken down into 15 minute periods instead of 10 minute periods.
| Team | 0-15 | 16-30 | 31-45 | 46-60 | 61-75 | 76-90 |
|---|---|---|---|---|---|---|
| Arsenal | 11-5 | 13-6 | 9-10 | 12-8 | 5-9 | 11-10 |
| Aston Villa | 5-11 | 6-4 | 10-10 | 7-4 | 12-9 | 12-16 |
| Brentford | 5-9 | 6-6 | 5-14 | 9-8 | 8-10 | 15-9 |
| Brighton | 4-6 | 4-8 | 8-8 | 7-7 | 5-7 | 14-8 |
| Burnley | 6-8 | 3-7 | 8-12 | 7-8 | 5-7 | 5-11 |
| Chelsea | 10-3 | 11-4 | 13-3 | 19-9 | 7-5 | 16-9 |
| Crystal Palace | 6-5 | 4-6 | 11-14 | 6-4 | 11-6 | 12-11 |
| Everton | 4-7 | 6-10 | 6-13 | 9-11 | 8-12 | 10-13 |
| Leeds Utd | 4-11 | 7-13 | 5-11 | 7-16 | 7-12 | 12-16 |
| Leicester City | 6-11 | 8-12 | 13-7 | 10-6 | 11-9 | 14-14 |
| Liverpool | 12-7 | 16-2 | 16-5 | 10-4 | 18-6 | 22-2 |
| Manchester City | 18-5 | 13-3 | 14-3 | 12-7 | 19-3 | 23-5 |
| Manchester Utd | 5-9 | 6-6 | 11-10 | 9-13 | 13-7 | 13-12 |
| Newcastle Utd | 7-3 | 3-12 | 15-9 | 8-8 | 6-14 | 5-16 |
| Norwich City | 4-12 | 3-7 | 4-15 | 4-12 | 2-20 | 6-18 |
| Southampton | 8-12 | 7-10 | 9-10 | 7-15 | 5-8 | 7-12 |
| Tottenham | 10-4 | 10-5 | 13-8 | 12-4 | 14-7 | 10-12 |
| Watford | 7-10 | 6-15 | 4-12 | 1-11 | 5-10 | 11-19 |
| West Ham Utd | 5-5 | 9-5 | 13-11 | 8-10 | 13-6 | 12-14 |
| Wolverhampton | 8-2 | 6-6 | 5-7 | 6-5 | 3-10 | 10-13 |
| Overall Totals | 290 | 294 | 384 | 341 | 354 | 480 |
| Total Percentage | 13.5% | 13.7% | 17.9% | 15.9% | 16.5% | 22.3% |
There are no huge changes between seasons.
If we look at it in 30 minute segments, we can see the difference between seasons:
- First 30 mins – 29% / 27.2%
- Second 30 mins – 30.4% / 33.8%
- Last 30 mins – 40.5% / 38.8%
A few percentage points here and there, but for the most part the spread is very similar.
Given that this is the case, we will stick with the 2018/19 season going forward so as not to overload the page, because the data avauilable is more detailed and makes the same point as more recent but less complete data.
What Is The Home – Away Split?
Now that we know the times that the most goals are scored in, it’s worth looking at what the split becomes depending on whether teams are playing at home or away. Here’s a look at the home figures for goals scored and conceded in each time period, as well as the totals:
| Team | 0-10 | 11-20 | 21-30 | 31-40 | 41-50 | 51-60 | 61-70 | 71-80 | 81-90 |
|---|---|---|---|---|---|---|---|---|---|
| Arsenal | 4-0 | 4-3 | 4-3 | 1-2 | 4-0 | 5-0 | 5-7 | 5-0 | 10-1 |
| Bournemouth | 3-0 | 3-3 | 3-3 | 4-3 | 4-2 | 1-5 | 1-3 | 4-1 | 7-5 |
| Brighton & Hove Albion | 0-1 | 1-2 | 5-3 | 2-4 | 3-4 | 1-2 | 2-3 | 3-5 | 2-4 |
| Burnley | 2-4 | 3-2 | 1-4 | 7-1 | 1-3 | 2-4 | 1-7 | 1-2 | 6-5 |
| Cardiff City | 2-3 | 2-5 | 1-3 | 2-4 | 3-3 | 2-4 | 3-7 | 2-1 | 4-8 |
| Chelsea | 3-1 | 4-1 | 3-1 | 3-2 | 4-1 | 4-4 | 5-0 | 4-1 | 9-1 |
| Crystal Palace | 0-0 | 1-2 | 2-1 | 4-1 | 2-3 | 0-6 | 2-3 | 4-3 | 4-4 |
| Everton | 1-1 | 5-2 | 4-1 | 3-4 | 3-4 | 4-2 | 3-5 | 2-1 | 5-1 |
| Fulham | 1-5 | 1-7 | 1-5 | 3-1 | 5-3 | 1-2 | 2-3 | 6-4 | 2-6 |
| Huddersfield Town | 2-3 | 0-4 | 1-3 | 1-4 | 0-5 | 3-3 | 0-2 | 0-6 | 3-1 |
| Leicester City | 1-4 | 4-2 | 3-1 | 1-2 | 1-3 | 2-2 | 4-2 | 2-1 | 6-3 |
| Liverpool | 5-1 | 8-1 | 6-0 | 2-2 | 8-1 | 5-0 | 5-2 | 5-1 | 11-2 |
| Manchester City | 8-0 | 7-1 | 6-2 | 4-2 | 9-2 | 7-2 | 5-3 | 5-0 | 6-0 |
| Manchester United | 3-2 | 3-0 | 6-3 | 1-0 | 4-4 | 2-5 | 3-3 | 5-3 | 6-5 |
| Newcastle United | 1-2 | 2-5 | 4-3 | 3-1 | 1-2 | 2-2 | 4-2 | 1-3 | 6-5 |
| Southampton | 2-1 | 5-1 | 2-4 | 3-4 | 4-3 | 2-6 | 3-2 | 3-1 | 3-8 |
| Tottenham Hotspur | 4-1 | 2-1 | 4-0 | 2-2 | 1-1 | 4-2 | 3-2 | 6-3 | 8-4 |
| Watford | 2-2 | 2-2 | 1-1 | 1-6 | 3-4 | 3-3 | 6-1 | 4-7 | 4-2 |
| West Ham United | 3-3 | 2-3 | 2-3 | 3-2 | 5-2 | 1-3 | 7-3 | 3-3 | 6-5 |
| Wolverhampton Wanderers | 1-1 | 4-5 | 2-3 | 1-0 | 2-1 | 2-2 | 5-4 | 6-2 | 5-3 |
| Totals | 83 | 115 | 108 | 98 | 118 | 112 | 133 | 119 | 186 |
| Total Percentage | 7.7% | 10.7% | 10.1% | 9.1% | 11.0% | 10.4% | 12.4% | 11.1% | 17.4% |
And here’s a look at the numbers for those same teams but when they’re playing away from home, again with the goals scored coming first and the goals conceded coming afterwards. Once more, the totals goals scored in each 10 minute block will be at the bottom:
| Team | 0-10 | 11-20 | 21-30 | 31-40 | 41-50 | 51-60 | 61-70 | 71-80 | 81-90 |
|---|---|---|---|---|---|---|---|---|---|
| Arsenal | 2-3 | 5-4 | 4-2 | 1-3 | 4-9 | 5-1 | 5-5 | 2-1 | 3-7 |
| Bournemouth | 0-4 | 4-5 | 1-4 | 3-8 | 6-5 | 3-3 | 2-5 | 3-5 | 4-6 |
| Brighton & Hove Albion | 2-3 | 2-0 | 1-6 | 1-4 | 1-4 | 2-3 | 4-6 | 2-4 | 1-2 |
| Burnley | 3-3 | 2-8 | 2-2 | 1-4 | 2-1 | 3-3 | 3-3 | 3-2 | 2-10 |
| Cardiff City | 0-3 | 1-3 | 2-2 | 0-2 | 1-3 | 1-3 | 1-5 | 2-2 | 5-8 |
| Chelsea | 0-2 | 3-5 | 2-2 | 3-1 | 3-4 | 4-5 | 1-3 | 2-3 | 6-2 |
| Crystal Palace | 1-1 | 2-0 | 1-2 | 6-3 | 3-4 | 3-3 | 5-5 | 4-5 | 7-7 |
| Everton | 4-1 | 3-0 | 1-2 | 2-2 | 1-5 | 1-3 | 5-5 | 4-4 | 3-3 |
| Fulham | 2-2 | 1-4 | 0-10 | 2-2 | 1-4 | 3-3 | 3-5 | 0-6 | 0-9 |
| Huddersfield Town | 2-3 | 1-5 | 1-6 | 2-3 | 1-5 | 1-1 | 2-5 | 1-7 | 1-10 |
| Leicester City | 0-4 | 0-3 | 2-0 | 2-5 | 3-3 | 5-2 | 1-5 | 6-0 | 8-6 |
| Liverpool | 1-1 | 2-1 | 5-2 | 2-1 | 4-0 | 2-2 | 7-1 | 3-2 | 8-2 |
| Manchester City | 4-0 | 6-1 | 2-1 | 5-1 | 4-1 | 5-1 | 7-1 | 1-2 | 4-3 |
| Manchester United | 3-1 | 2-6 | 3-6 | 8-1 | 3-3 | 4-2 | 2-4 | 3-4 | 4-2 |
| Newcastle United | 4-3 | 3-1 | 3-1 | 2-2 | 1-3 | 2-2 | 1-1 | 0-3 | 2-7 |
| Southampton | 1-4 | 3-5 | 2-2 | 0-3 | 3-3 | 5-6 | 0-3 | 2-3 | 2-6 |
| Tottenham Hotspur | 2-2 | 2-3 | 7-1 | 3-0 | 6-0 | 4-4 | 5-2 | 2-5 | 2-6 |
| Watford | 3-2 | 3-4 | 3-2 | 2-4 | 1-3 | 1-2 | 6-2 | 3-5 | 4-7 |
| West Ham United | 0-2 | 4-3 | 4-3 | 2-1 | 1-4 | 2-4 | 3-2 | 3-3 | 1-6 |
| Wolverhampton Wanderers | 1-4 | 3-2 | 1-5 | 0-1 | 2-3 | 3-0 | 1-1 | 2-5 | 6-4 |
| Totals | 83 | 115 | 108 | 98 | 118 | 112 | 133 | 119 | 186 |
| Total Percentage | 7.7% | 10.7% | 10.1% | 9.1% | 11.0% | 10.4% | 12.4% | 11.1% | 17.4% |
Obviously the total number of goals scored within each ten minute time slot is the same, given that the same teams will be playing at home as well as away from home. Even so, it’s interesting to note that some teams are more likely to score away from home or concede when playing at their own stadiums.
Another interesting thing to take away from the tables is the fact that the most goals are scored in the last ten minutes of matches, which of course include any stoppage time that the referee has chosen to add on to the end of the match. It’s equally as note worthy that the same cannot be said for the period that includes the end of the first-half and start of the second.
How The Championship Compares
| Overall | 0-10 | 11-20 | 21-30 | 31-40 | 41-50 | 51-60 | 61-70 | 71-80 | 81-90 |
|---|---|---|---|---|---|---|---|---|---|
| Aston Villa | 8-8 | 10-2 | 7-7 | 6-4 | 8-10 | 8-8 | 12-4 | 9-9 | 14-9 |
| Birmingham City | 6-1 | 6-6 | 11-7 | 2-6 | 12-9 | 4-5 | 7-6 | 8-9 | 8-9 |
| Blackburn Rovers | 4-7 | 5-6 | 10-3 | 1-5 | 10-2 | 8-7 | 4-7 | 9-15 | 13-17 |
| Bolton Wanderers | 2-6 | 2-7 | 1-9 | 4-7 | 2-6 | 4-12 | 4-11 | 4-7 | 6-12 |
| Brentford | 5-8 | 6-10 | 8-13 | 3-3 | 11-3 | 8-5 | 9-4 | 6-7 | 16-6 |
| Bristol City | 3-3 | 5-5 | 3-2 | 5-9 | 5-10 | 6-9 | 11-8 | 9-5 | 12-2 |
| Derby County | 7-8 | 8-4 | 10-6 | 8-3 | 6-7 | 7-7 | 4-7 | 11-4 | 8-8 |
| Hull City | 8-5 | 2-6 | 10-8 | 3-4 | 11-10 | 8-8 | 9-9 | 9-6 | 6-12 |
| Ipswich Town | 4-10 | 1-8 | 3-9 | 8-6 | 6-7 | 3-8 | 2-9 | 2-13 | 7-7 |
| Leeds United | 4-7 | 6-3 | 6-8 | 5-1 | 8-8 | 9-6 | 11-6 | 7-5 | 17-6 |
| Middlesbrough | 4-2 | 8-5 | 4-3 | 10-5 | 4-4 | 5-3 | 2-7 | 3-5 | 9-7 |
| Millwall | 4-5 | 4-8 | 6-5 | 4-4 | 5-9 | 6-3 | 6-4 | 5-10 | 8-16 |
| Norwich City | 5-3 | 10-6 | 9-7 | 9-5 | 2-10 | 15-5 | 7-6 | 13-4 | 23-11 |
| Nottingham Forest | 9-6 | 4-5 | 4-4 | 3-2 | 5-4 | 5-7 | 12-5 | 11-8 | 8-13 |
| Preston North End | 8-0 | 7-1 | 4-6 | 7-11 | 6-11 | 5-6 | 6-8 | 9-11 | 15-13 |
| Queens Park Rangers | 4-7 | 3-4 | 7-9 | 7-5 | 9-9 | 7-6 | 2-7 | 5-7 | 9-17 |
| Reading | 6-5 | 5-7 | 7-3 | 2-6 | 6-12 | 2-5 | 5-7 | 3-9 | 13-12 |
| Rotherham United | 4-7 | 5-4 | 3-9 | 4-9 | 6-12 | 9-10 | 2-6 | 10-10 | 9-16 |
| Sheffield United | 9-3 | 5-3 | 6-4 | 6-2 | 13-4 | 7-2 | 9-7 | 13-5 | 10-11 |
| Sheffield Wednesday | 3-3 | 10-4 | 2-5 | 4-6 | 12-6 | 7-10 | 10-8 | 4-9 | 8-11 |
| Stoke City | 4-3 | 3-4 | 7-6 | 2-4 | 8-11 | 5-5 | 7-5 | 5-5 | 4-9 |
| Swansea City | 6-6 | 2-6 | 8-6 | 9-9 | 5-6 | 4-6 | 8-7 | 11-9 | 12-7 |
| West Bromwich Albion | 4-8 | 7-9 | 7-5 | 4-3 | 15-4 | 8-8 | 12-6 | 14-7 | 16-12 |
| Wigan Athletic | 5-5 | 4-5 | 6-5 | 8-5 | 7-8 | 8-7 | 5-12 | 3-4 | 5-13 |
| Totals | 252 | 256 | 298 | 248 | 364 | 316 | 332 | 366 | 510 |
| Total Percentage | 8.6% | 8.7% | 10.1% | 8.4% | 12.4% | 10.7% | 11.3% | 12.4% | 17.3% |
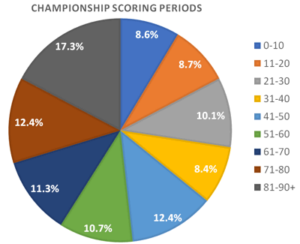 It’s also worth having a quick look at how the Championship compares, to see whether there is any correlation with a slightly lesser quality of football. We won’t break it down as far as home and away goals this time, but above we look at the total number of goals scored in each period during the 2018-2019 season of the second tier of English football.
You can see, then, that the final 10 minutes of the game remains the most prolific in terms of goals scored regardless of the level that the match is played at. Unlike in the top-flight, however, the penultimate 10 minutes of matches is when the next highest number of goals are scored and the ten minutes at the end of the first-half and the start of the second comes next.
This tells us that as games are nearing their conclusion, teams want to score. This will be when matches tend to open up the most, either because a team is looking for a goal and therefore leaving themselves exposed, or else because they’ve managed to get the goal that they were after. In either case, tired legs and minds will also doubtless play a part.